Intro
I love monitoring. I really do… Probably anyone who has worked as an SRE or has been on call shares the same sentiment. Staring at a bunch of big screens for hours, every day waiting for that… alert?
Throughout the years we’ve had the chance to play with myriads of monitoring tools, targeting all kinds of systems. From your classic basement servers to your modern platform agnostic microservices. Some promised being open source, some being easier to use, but they all shared one key flaw:
Someone had to configure the entire system, and chances were you would be that person.
Consequently, sharing all this monitoring love, even with other devs, proved to be really hard. Sometimes they did not like what you did there or simply did not even have a clue on what you were rambling about…
Luckily enough, it’s 2020 already and the way we are developing and deploying software has changed significantly over the last few years, or at least it should have. The same should happen with the tools we are using to monitor our systems. Why? Well, amongst many reasons out there like microservices, faster delivery, agile, devops, k8s etc. there is one really important reason… To spread the monitoring love with everyone in your team!
Developing software is a team effort and reliability should be a team effort as well. You cannot expect one guy to detect and fight the fire alone. That’s why you should embed ownership in everyone’s work. Everyone in your team should look after the code they are writing when it reaches production. Hence, your team should write checks/tests, and these checks/tests should seamlessly integrate into your monitoring solution. Endpoints checks, health statuses etc. should be software. Everything should be written as a code, version controlled and always there for you to deploy it again and again. How can you achieve that? I think it is time to talk about SensuGo and how we recently used it to deploy a self-service monitoring solution on AWS for one client we were working for.
SensuGo has been around for a while but recently it has been completely re-rewritten in Go! The new tool as you can imagine is now called SensuGo, which sounds cool right? However, was it just the name and the code that has changed? Not really…
What SensuGo introduces is a brand new k8s (kubernetes) like architecture and a lot of features which we will briefly mention. SensuGo now uses an etcd cluster as its datastore (embedded or external, whatever you like) or a Postgres database if you want to… go big. We’re now having built in RBAC and dashboard; the old dashboard is GOne. A feature we really liked is the assets concept. Assets are shareable, reusable packages that make it easy to deploy SensuGo plugins in multi-cloud environments. You can use assets to provide plugins, libraries, and runtimes you need to automate your monitoring workflows (bye bye env dependencies, hello self-service). The powerful sensuctl CLI is still there for managing resources within SensuGo and the agents use WebSockets to connect to your backend. Many more features are there but those were probably the most important ones.
Motivation
My objective was to create a self-service monitoring solution that everyone in our team/organization will be able to use. Our deployment architecture was based on the following principles which heavily suggest following:
Everything as a code.
SensuGo Cluster Infrastructure
In order to achieve the automation of the infrastructure deployents we used ansible and terraform. Ansible is responsible for configuring the servers post-deployment and terraform is there to help with the infrastructure definitions. This means that our cluster can be built whenever we want, just by triggering a Jenkins job.
SensuGo configuration
We’re happy to say that NOTHING is built manually. SensuGo checks, handlers, mutators, filters, roles, users etc. are code. That code lives in the form of an ansible role. Whenever we run the corresponding playbook, we have a full environment up and running in minutes. The most important things:
● Our devs can write checks (with their tests) and commit them. Our CI pipeline is triggered and if the tests pass we’re integrating them to our monitoring solution. If not, we simply roll back and warn them (e.g. via slack & email)
● The checks are being reviewed using PRs. Other devs are able to comment on that PR and everyone is aware of the new things. That simple.
Everything automated and redeployable.
As already mentioned, automation is the key to success and helps TOIL elimination. We’re getting all that help from Ansible and Terraform but Ansible is there to help us configure the servers and SensuGo itself. Terraform is there just to provide all the infrastructure we need. Obviously, any other infrastructure and configuration management tools would do the job as well.
Everything tested
We cannot stress enough the importance of testing. Do you imagine having a monitoring solution which does not actually detect failures or raises alerts in cases of false positives?
Your engineer on-call just woke up for no reason. Keep your team happy!
Write more tests, integrate them and keep the people happy. Monitoring is there to help you act proactively and avoid panicking situations when something is wrong.
I mean it. Have tests for everything.
You obviously got the point…
Engage with your team and create focus groups.
● Assuming that your solution has been deployed, and your configuration is automatically deployed in case of changes, you now have to visualize your errors and metrics so that everyone is aware of them. Just remember, not everyone dealing with errors is an engineer and on the same team, but everyone should be able to understand that something is wrong.
● Keep a clean, not too complicated, single pane of glass for your monitoring solution. Logs do not exist here. Just let your team know that you have an error. Your SRE knows what to click next.
SensuGo Sample Architecture on AWS
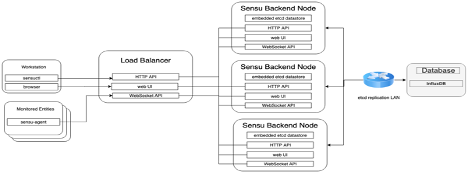
We deployed SensuGo across 3 AZs. The nodes are part of an autoscaling group which is set to have a fixed size (we explain why later). The communication with the backend nodes is realized using an ALB with a DNS address assigned and resolved by Route53. Additionally, the ALB will handle the SSL termination for external traffic. For the sake of security, at the cost of speed, we decided to go with full encryption, leveraging both Hashicorp Vault and AWS Certificate Manager for the generation/update of both backend and the frontend, respectively. This way we’re confident that a user who wants to access and manage the SensuGo cluster can do so safely through the built-in dashboard (available through the ALB endpoint), the sensuctl command line tool and also trust that the information sent by the agents is safe from random prying eyes.
With the SensuGo backend deployed, we need a database to store all the data we’re collecting as well as a medium where we can save our data in the long term and also use it for data analysis. Unfortunately, by design SensuGo only stores the last 25 events in etcd. Due to the nature of our data, a time series database like InfluxDB fills this hole quite nicely. Since we want to keep costs to a minimum we decided to deploy a cluster of the free version of Influx using a tool called Influx-relay in order to achieve HA. Despite not being updated recently, after playing with it we found that it did the job. Finally we’re using Grafana to connect to Influx’s endpoint and visualize all the SensuGo data. Below you can check the overall architecture of our SensuGo deployment on AWS [IMG1] and Sensu’s internal architecture [IMG2].
Building a robust etcd cluster
SensuGo architecture has been changed significantly and tries to follow the new software trends. This is why etcd is now being used. This can be explained if you consider that you might already have an etcd cluster from your K8S cluster! Etcd is a strongly consistent, distributed key-value store that provides a reliable way to store data that needs to be accessed by a distributed system or cluster of machines. It’s also the default DB SensuGo uses, and it’s heavily coupled with it. Therefore it’s important to understand how etcd handles leader elections in order to implement our cluster.
Leader elections are realized using an algorithm/protocol called Raft for achieving consensus. It works by syncing a change log across the instances, a replicated state machine. The state machine is kept in sync through the use of a replicated log. For more detailed information you can check https://raft.github.io/.
Knowing how Raft works it’s easier to identify what the problem with etcd might be:
Consensus or Quorum
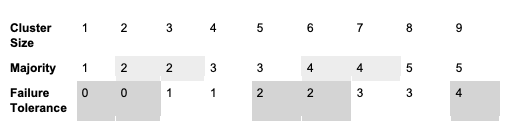
Clustering requires an odd number of backend instances. While larger clusters provide better fault tolerance, write performance suffers because data must be replicated across more machines. Following on the advice of the etcd maintainers, clusters of 3, 5 or 7 backends are the only recommended sizes. Embedded etcd databases of multiple SensuGo backend instances can be joined together in a cluster, providing increased availability and replication of both configuration and data. The table below describes how many failures an etcd cluster node can tolerate according to its cluster size.
So, how can we make sure that we always have 3, 5 or 7 nodes? Autoscaling for the win!
Thanks to the AWS Autoscaling groups (ASG) we’re able to guarantee that our SensuGo cluster will hold the right size per our configuration (ex: 3:3:3) and ensure that the expected number of min, desired and max nodes are always available, spreading through each AZ (ideally 3 or more AZs). It is worth mentioning that auto-scaling here is not used to dynamically scale in and out rather than maintaining a fixed 3 node cluster.
With our ASG setup, launch templates as well as health checks configured we’re nearly ready to have our cluster up and running 24/7.
SensuGo Golden AMI Images
Instead of deploying the infrastructure we need and then configuring it using e.g., using Ansible, we decided to create a golden image pipeline to create images on demand. The pipeline can be created in numerous ways: AWS’s built-in golden ami pipeline, custom scripts, packer, manually (do not even dare)… Just pick what suits your environment better.
These images are being generated independently and they have SensuGo binaries and dependencies pre-backed in them, thus saving a lot of time when deploying new instances or restoring failed nodes. Otherwise, the time to recover in production would end up being too long.
Another problem we’re solving is patching and updating/upgrading the instances since everything is happening using the golden image pipeline and the ASG (being used for rolling upgrades).
Any files/configurations require dynamic intervention you should leave their bootstrapping to the userdata script, which is executed by all new nodes during the boot phase. It’s also here where we handle registering new nodes as well as removing old ones from the cluster ecosystem. Check the best practices section below to find out what we did in terms of configuration.
Best practices:
During the deployment I have changed several things, several times. Here’s some distilled knowledge:
Build a robust etcd cluster:
● You are relying on etcd. If etcd dies, your service dies and we do not want that. Read the etcd section above for some ideas. You could also reuse an existing etcd cluster or get one as a managed service (which AWS provides);
Be creative with the cluster node names:
● We’re deploying things on AWS. Instead of backend-1 or backend-2 we could use the instance id names, which can be dynamically obtained from the instance metadata service. This solves a lot of problems since we are not relying on specific names and it is 100% sure that we will not have conflicts in the names;
Autoscaling does not necessarily need to be used to scale in and out your servers.
Size your environment properly:
● In case you’re wondering what type of hardware to use, think no more. You can find some really useful info here:
i. https://etcd.io/docs/v3.3.12/op-guide/hardware/
ii. https://docs.sensu.io/sensu-go/5.15/installation/recommended-hardware/
Load balancing is made easy thanks to AWS. ALB is the best choice for microservices based architectures and also supports websockets needed for the agent communication. Among other features it also offers built-in-authentication, which can be extremely useful since at the moment of writing Sensu’s SSO support mature enough.
Use RBAC wisely
● This is going to solve many issues around multi tenancy, SSO etc.
Create golden images
● Save yourself and your team a lot of deployment time
Utc clock
● Many things in life have to do with good timing. We are going to apply the same in our cluster. We do want to have our cluster in perfect sync and this is going to happen by using the same clocks,
Security is a habit not an act (seriously paraphrasing Aristotle here…but it is true).
● i.e. think, before you start having problems…
Certificate management
● There are some nice solutions out there, e.g. AWS or Vault
Version control your checks
● Everything as a code…
Have naming conventions for everything
● Make it look nice!
Lint, lint, and lint some more!
Someone needs to monitor your monitoring system.
● For obvious reasons. Luckily this can happen using Cloudwatch and custom alerts (even using Lambda functions + Lifecycle policies)
Build a CI pipeline
Keep simple documentation and include some use cases
Ownership — Share it!
Use tags and prefixes for your resources
It’s open-source. Become part of the community and talk!
Am I forgetting something?
Probably! If everyone in your team knows what is happening though, they will let you know! Keep everyone involved. Monitoring and reliability are a team effort.
p.s. Special thanks to Goncalo Barroso and Robert Mason for reviewing the article and making this an easier read for everyone.